The Sea Level Calculator: A Comprehensive Data Resource for Coastal Communities
The Takeaway: By streamlining existing data sources into one platform, the new tool provides easier access to critical coastal information.
With changing sea levels and more frequent and intense storms, tens of millions of people in the U.S. are at risk from coastal hazards. Communities need to understand how sea level and flooding are changing in their location so they can adapt to these risks.
NOAA combined existing data into a comprehensive product to make this information more accessible. The Sea Level Calculator is a technical tool that allows users to see how sea level and flooding frequency have changed in their location over time. Users can access location-specific data and generate maps and graphics that showcase future scenarios as well as past and current conditions.
The calculator includes five quick views tailored to your location and updated continuously as new data becomes available. With more accessible data, maps, and visualizations, communities can plan, design, and build for more resilient coasts.
Future Sea Levels
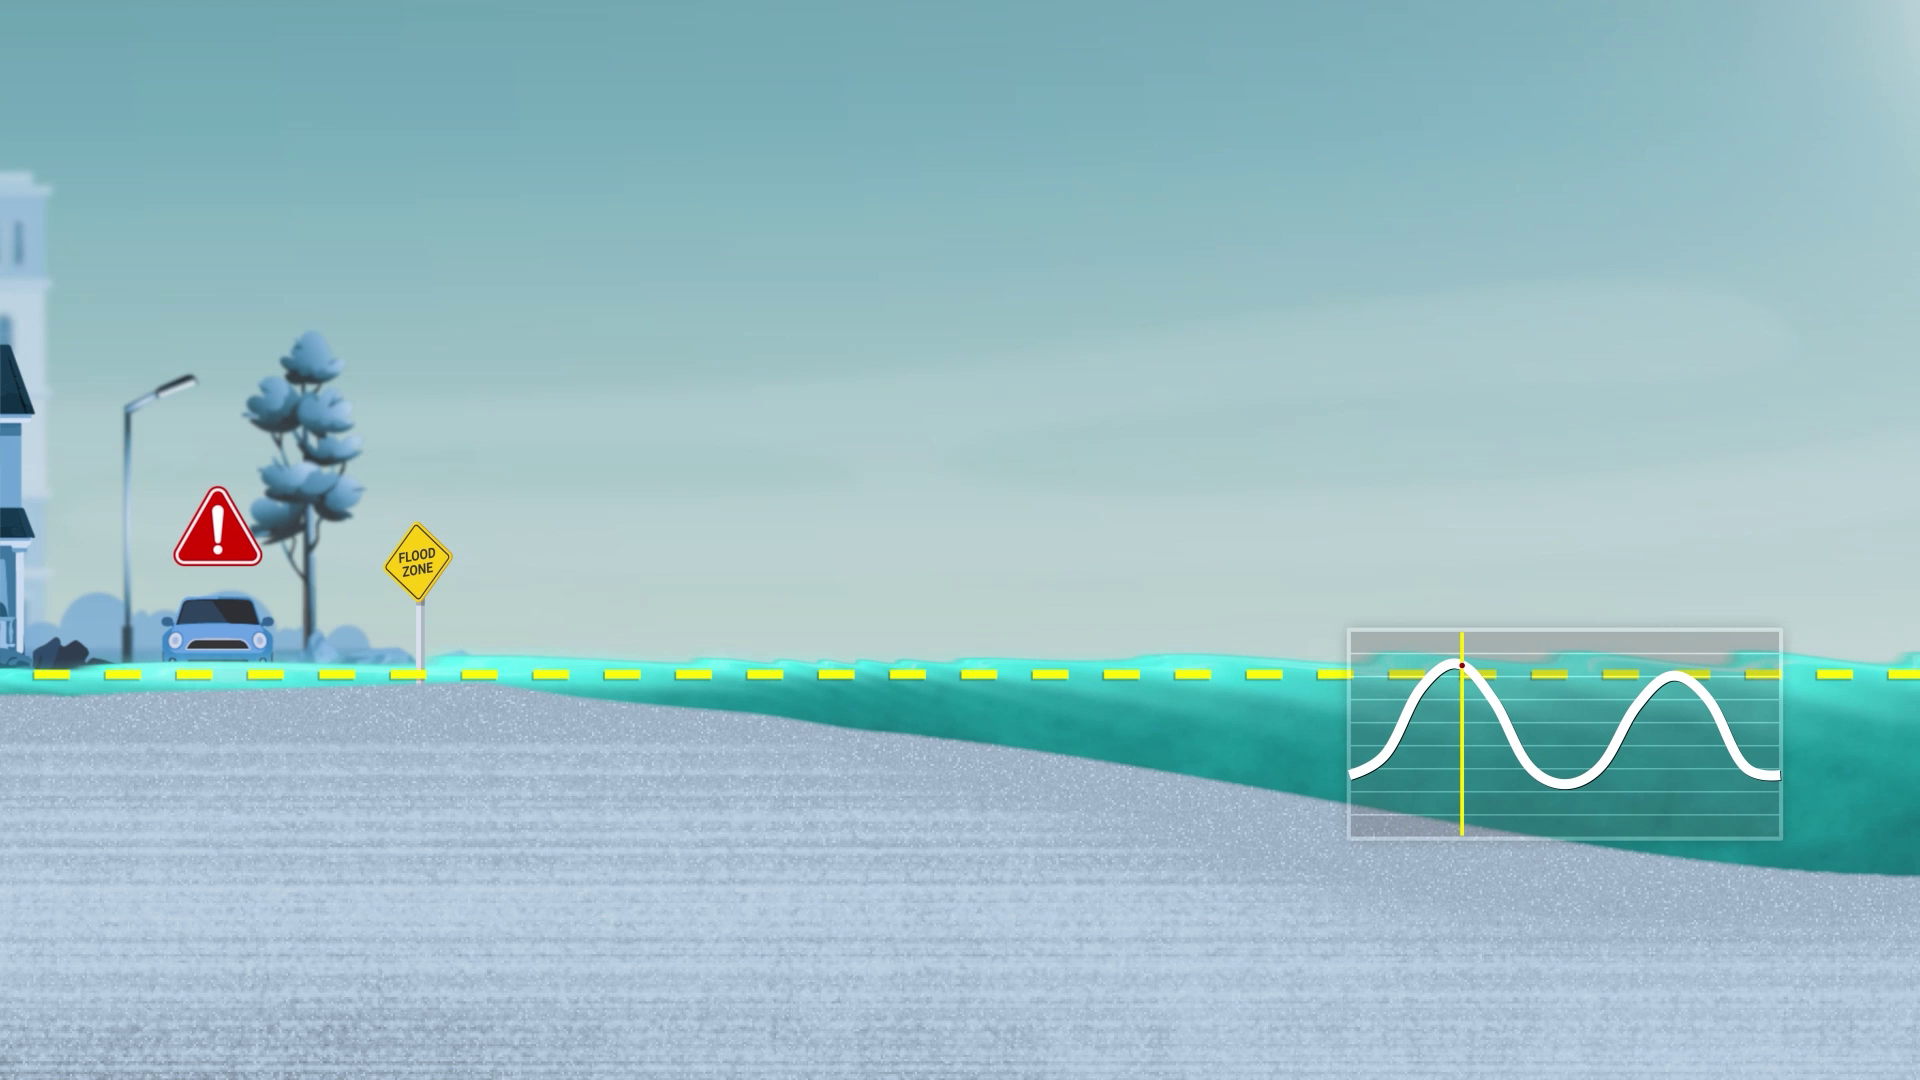
While ice sheet melting is the largest contributor to sea level rise, other processes, such as land motion, contribute to sea level changes–rising or, in some cases, falling–at the local level. The sea level calculator can be used to explore projections and the processes contributing to sea level change. Users can also visualize when different flooding thresholds will be reached and when high tide flooding might become a daily occurrence.
- How it’s used: Local sea level scenarios can help chief resilience officers with coastal planning over near- and long-term timelines. Using the tool, they can compare flooding scenarios that are most appropriate for their community, illustrating where to invest resilience funding. Knowing at what elevations flooding typically occurs in their communities, they can use the thresholds feature to demonstrate when those lines will be crossed.
Changes in Flood Frequency
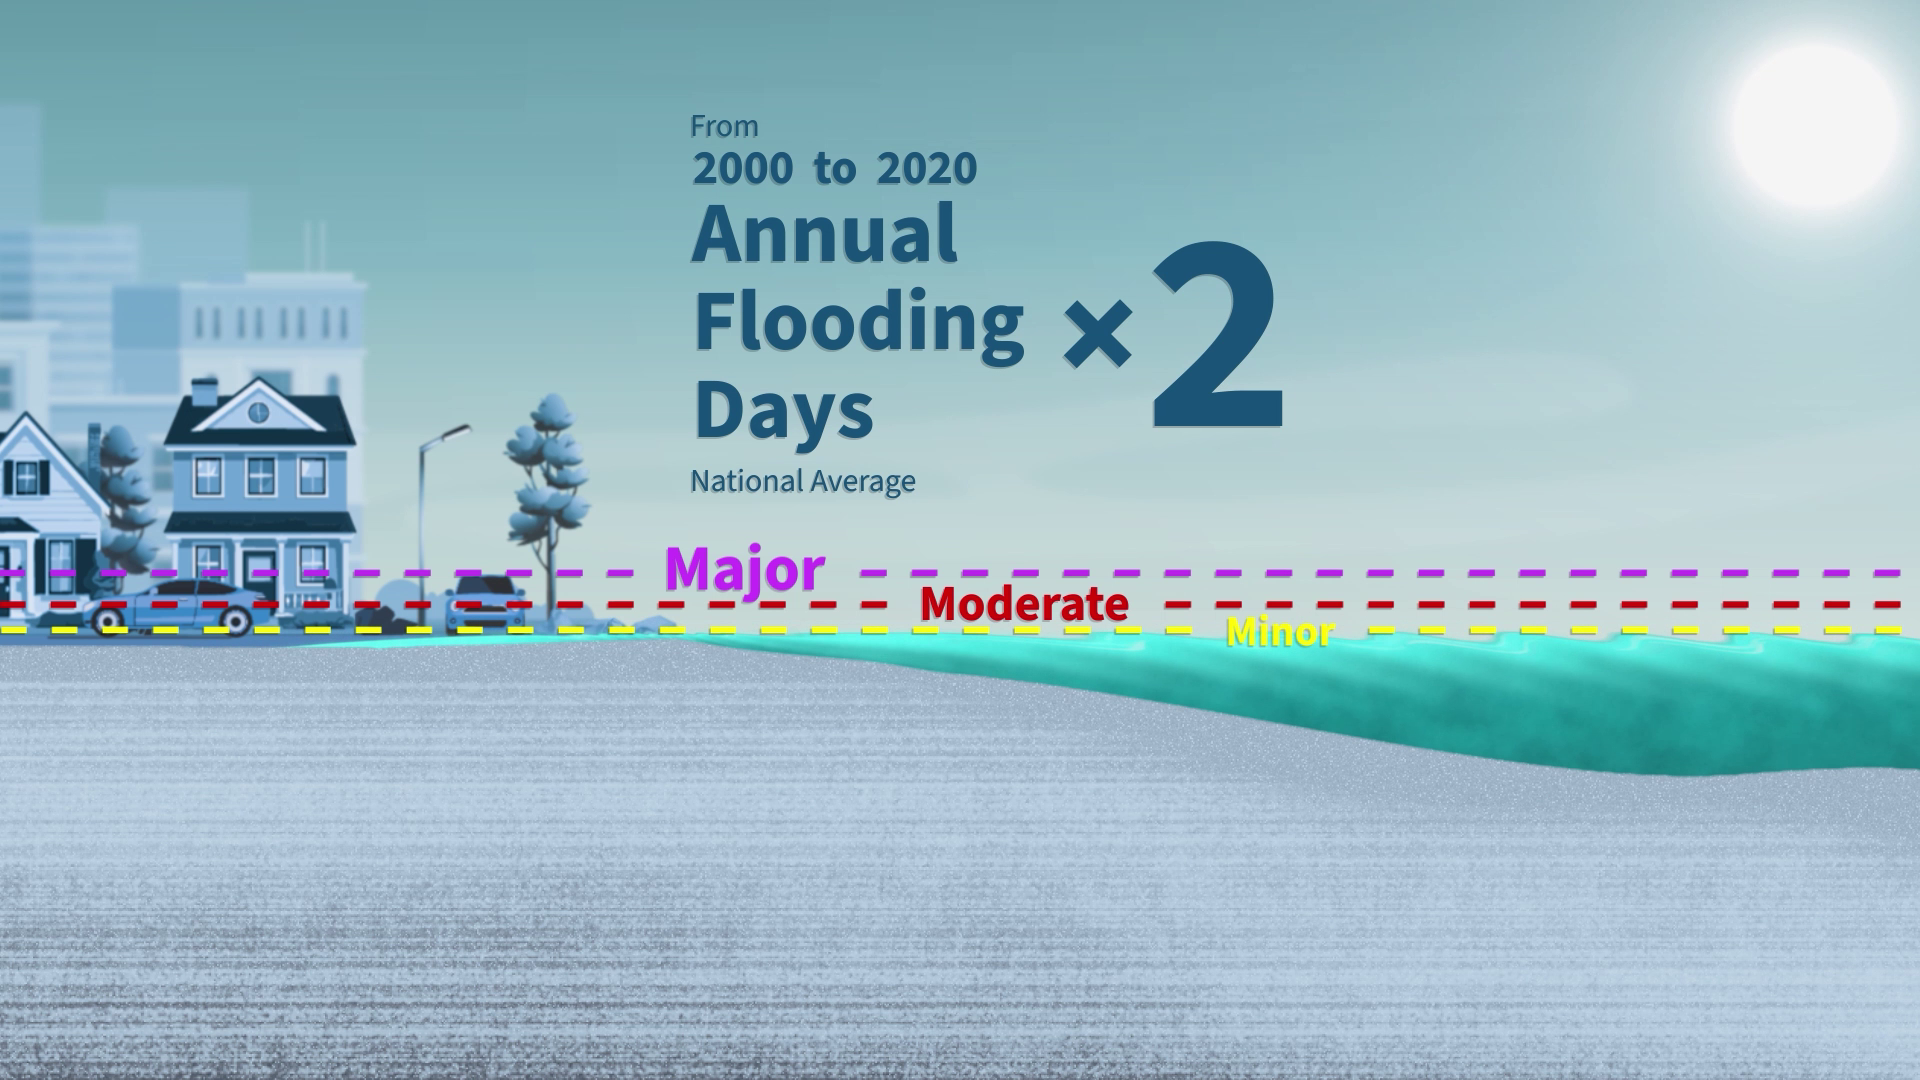
From 2000 to 2020, the number of annual flooding days doubled in the U.S. This increase was worst in the Southeast and Gulf Coast regions, where flood days were 400 and 1,100 percent more frequent. The sea level calculator can show how flood frequency has been increasing (or not!) in a given area and how these conditions may change in the future.
- How it’s used: Local floodplain managers often use projections on flood frequencies to recommend zoning changes and secure funding for flood control projects. With the tool, they can use built-in flooding thresholds or choose their own to assess how often specific water levels have been and will be exceeded. They can access graphs, maps, and other visualizations to help communicate flood risk to their community.
Extreme Water Levels
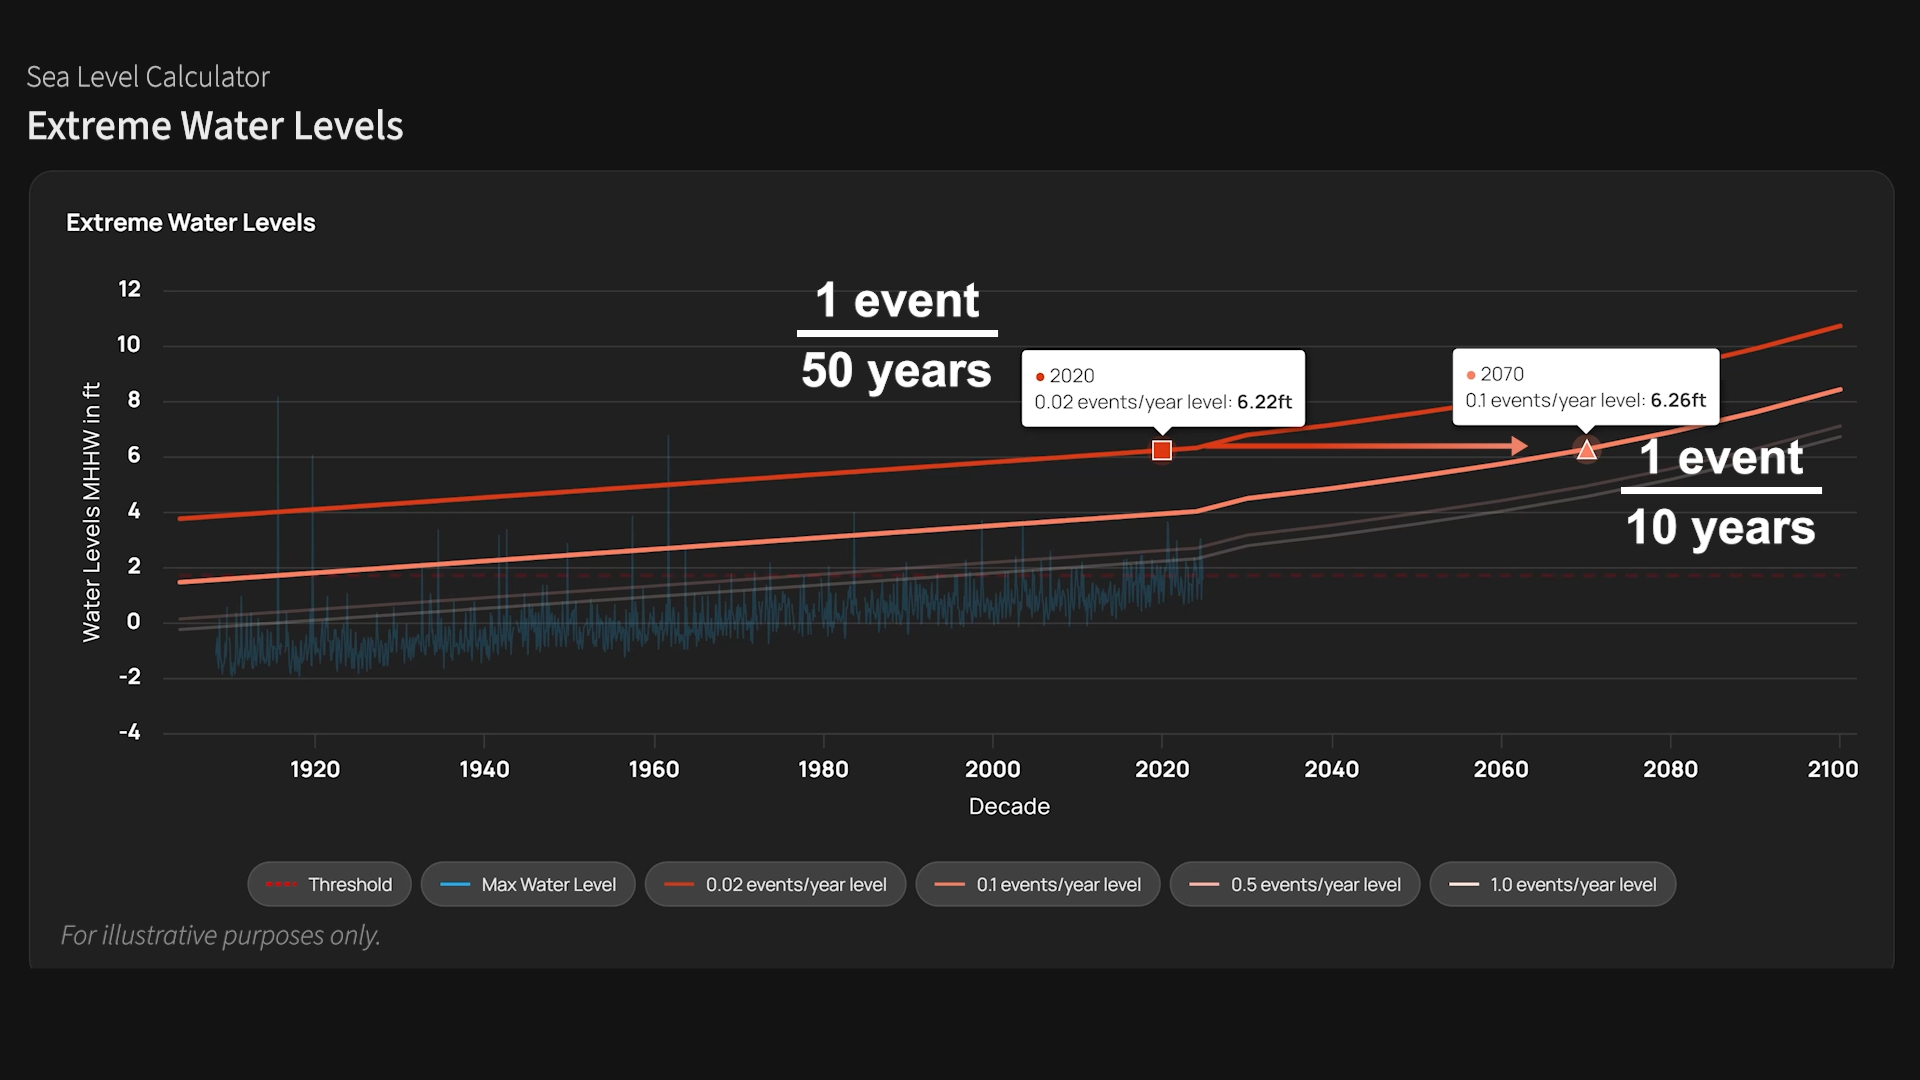
As sea levels rise, once-rare extreme flooding events are becoming more frequent. The sea level calculator allows users to explore the frequency and severity of extreme water levels, which can lead to flooding. The tool shows extreme flood event data, annual change probabilities, and how changing sea levels may alter these probabilities over time.
- How it’s used: Extreme water level probabilities help structural engineers set safe building elevations, especially for structures in flood-prone areas. They can use annual exceedance probabilities from the tool in their designs, preparing buildings for both current and future flood extremes.
Observed Sea Level Trends
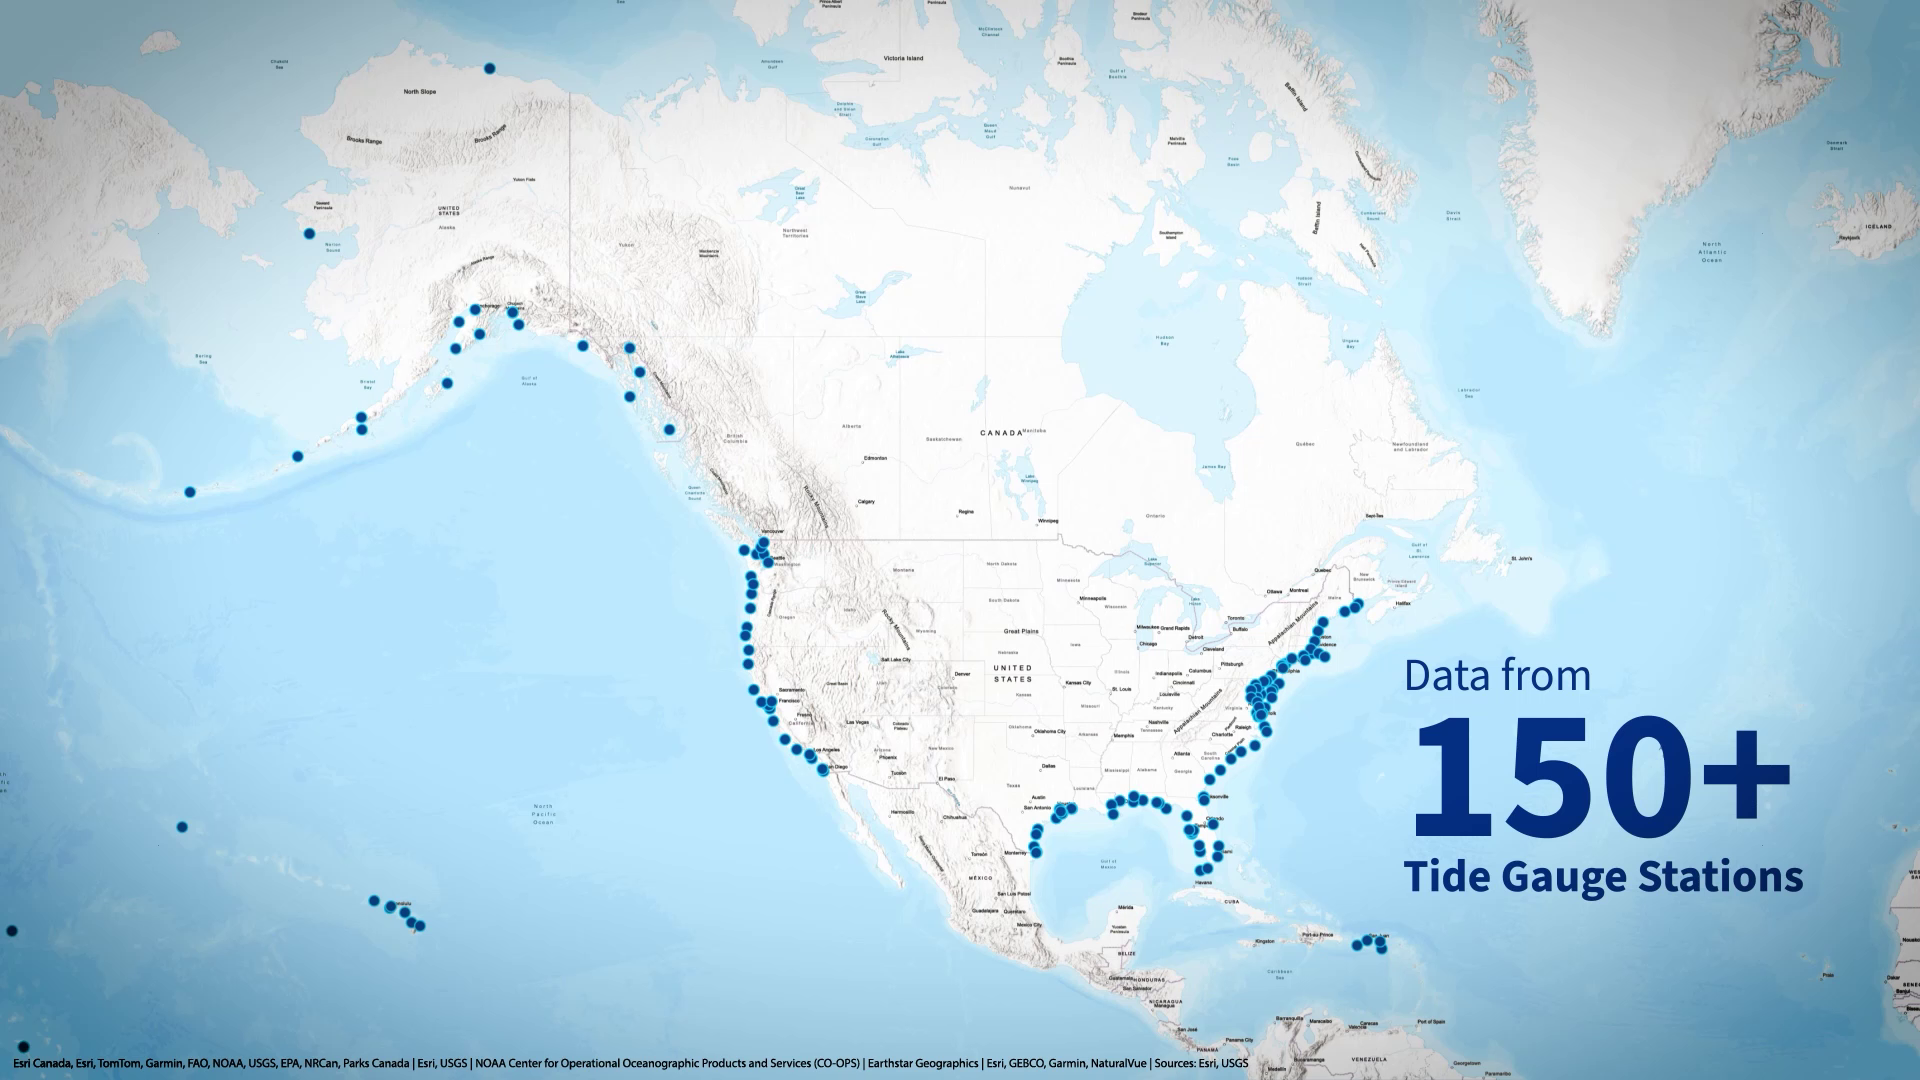
NOAA has been tracking coastal water levels for decades at more than 150 tide gauge stations. Users can explore this data to see how water levels have changed in a location over time, and where they might be in the near future based on local and regional observations. Comparisons between different trends can show how vertical land motion contributes to the equation.
- How it’s used: Land use planners can look at past sea level trends to guide zoning policies and help communities understand how local water levels have changed over time. Using the tool, they can compare local change against global trends to justify taking immediate action in places where sea level is changing more rapidly.
Seasonal Variation
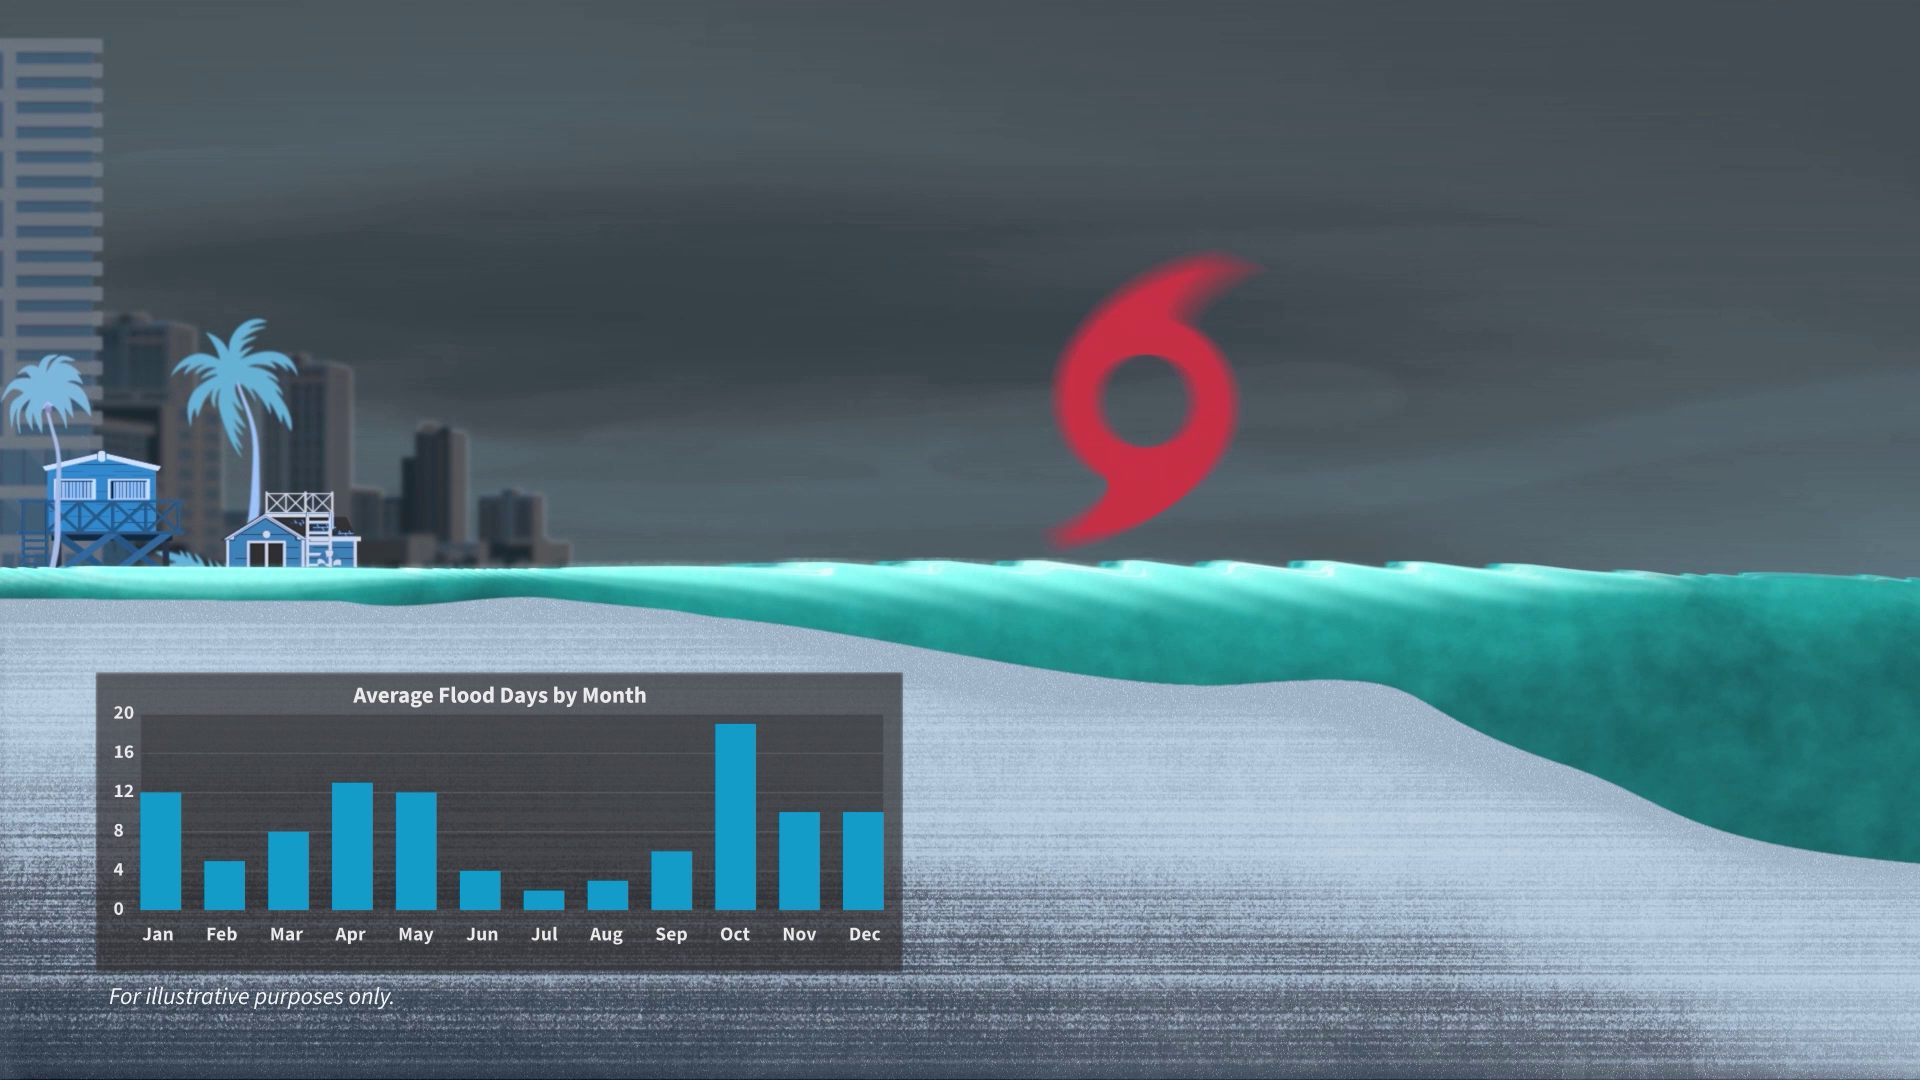
Flooding fluctuates throughout the year due to seasonal cycles in temperature, winds, and storms. With the calculator, users can determine which months their community is most likely to experience a flood, and get the dates of the ten most extreme flood events of the past.
- How it’s used: Understanding seasonal flooding periods can help natural resource managers plan ahead for park closures or maintenance needs. With their knowledge of local habitat areas, they can use the tool’s monthly flood probabilities to determine when to limit public access, reducing disturbance during critical flooding months.
These data views are available as part of the first version of the sea level calculator. The second version will include higher-resolution data that allows for even more precise, location-based analysis. Reach out to coastal.info@noaa.gov with any questions or suggestions for future versions.
Partners: NOAA Office for Coastal Management, NOAA Center for Operational Oceanographic Products and Services
PRINT